


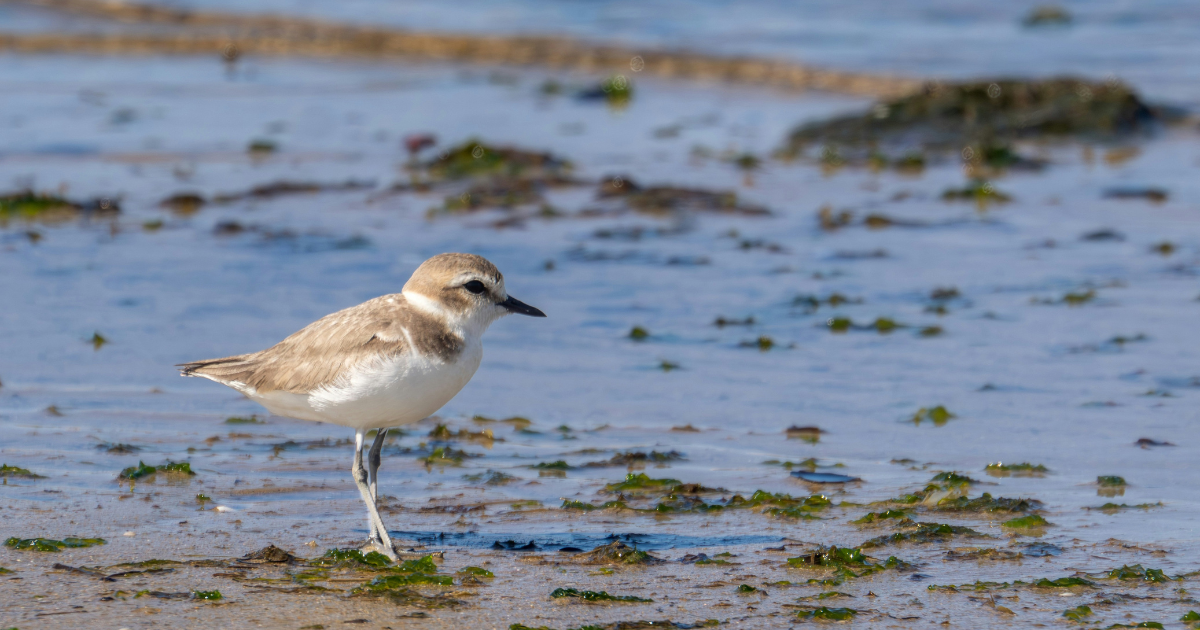
Learning the name of one animal can change what you notice about a familiar place. Once you have identified it, another question may follow: what else lives here?
 ミミズク先生
Fauna refers to the animal species of a particular region or environment.
A species list offers a starting point for understanding a place. Read the names alongside information about where, when, what and how people surveyed, and you begin to see what the records actually establish.
Two published studies provide our examples: a report on specimens from the seabed around Hachijōjima Island, and a survey of rove beetles beneath seaweed on the coast of Fukuoka, Japan. Together, they show how to read a faunal list—and how the same attention to evidence can inform observations close to home.

What Is Fauna?
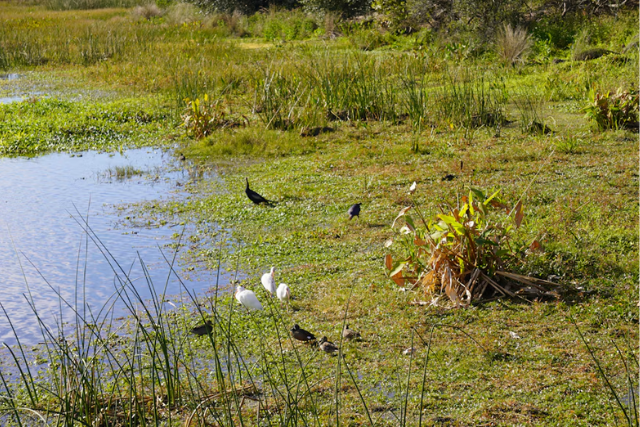
The basic question behind a study of fauna is straightforward: which kinds of animals occur in this place? It shifts our attention from the features of one individual to the animal species recorded across a region or environment.
The Animal Species of a Region or Environment
Fauna describes the composition of animal species in an area: in other words, which kinds of animals are present. It includes insects and molluscs as well as birds, fish and other animals.
The area may be a continent, an island, a park or a river, depending on the purpose of the study. It can also be defined by its environment, as in “forest fauna”.
The scope may be restricted to a particular group. The insect fauna of a region concerns its insects; the bird fauna concerns its birds.
The word fauna does not, by itself, tell us how many individuals of each species occur there, or what they eat. A faunal survey may record abundance too, but species composition, numbers of individuals and relationships among species are different kinds of information.
Fauna, Flora, Biota and Biodiversity
Flora refers to the plant species of a region or environment. In a park, a survey of birds and insects concerns fauna; a survey of grasses and trees concerns flora.
Biota is broader, encompassing the organisms of a place, including animals, plants and microorganisms.
| Term | Main focus |
|---|---|
| Fauna | The animal species of a region or environment |
| Flora | The plant species of a region or environment |
| Biota | The organisms of a region or environment, including animals, plants and microorganisms |
| Biodiversity | Diversity within species, between species and of ecosystems |
The terminology follows the dictionary sources listed in the references. The scope of biodiversity follows Article 2 of the Convention on Biological Diversity.
The Convention on Biological Diversity, or CBD, is an international treaty concerned with conserving biodiversity, using its components sustainably, and sharing the benefits arising from the use of genetic resources fairly and equitably.
A list of animal species can show which animals are known from a place. On its own, however, it does not describe genetic differences within those species or the diversity of ecosystems.
Fauna and biodiversity are related, but they are not interchangeable.
Names That Group Animals by Size
Fauna also appears in terms that group animals by size. Examples include megafauna for large animals and mesofauna for certain small animals in soil and leaf litter.
These are not taxonomic groups defined by evolutionary relationships. They are ways of describing or delimiting the organisms included in a study.
The terminology and size boundaries differ between fields. Terms used for soil animals do not necessarily correspond neatly to those used for animals living in bottom sediments.
| Term | Typical usage | Examples or contexts |
|---|---|---|
| Megafauna | Animals considered large within a particular field of study; the threshold varies | Large land animals such as elephants, or large marine animals |
| Macrofauna | Relatively large animals in soil or bottom habitats | Earthworms and termites in soil studies |
| Mesofauna | Small animals, especially in soil and leaf litter | Springtails and mites |
| Meiofauna | Small animals living in bottom sediments, including spaces between sediment grains | Nematodes and small copepods |
Moleón and colleagues’ review explains how definitions of megafauna vary with the ecosystem and research question. The soil-animal examples follow FAO material, while the description of marine meiofauna follows NOAA Ocean Exploration.
Microfauna is another term used for microscopic organisms in such studies. Its scope requires particular care: some traditional usages include protists, so it does not always correspond exactly to animals as recognised in current classification.
Rather than memorising these terms as a single universal size ladder, check the environment, the organisms included and the study’s definition.
ミミズク先生These categories tell us how the organisms have been grouped for study, not how they are related. Before comparing two reports, check how each defines its terms.
Names That Describe Where Animals Live
On the seabed, some animals live on exposed surfaces, while others live within sand or mud. Epifauna and infauna describe this distinction, not body size.
- Epifauna are animals living on the seabed surface, rocks or the surfaces of other organisms.
- Infauna are animals living within sediments such as sand and mud.
A survey of exposed surfaces and one that collects sediment to examine its contents can reach different animals.
Even the phrase “a survey of seabed animals” needs context. Did the researchers examine the surface, the sediment beneath it, or both?
From One Animal to the Animals of a Place
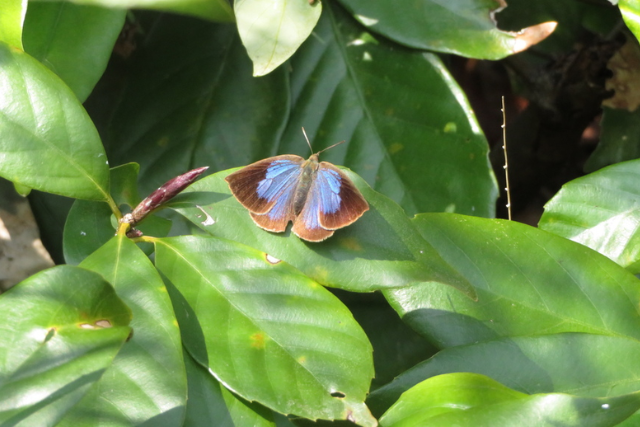
Source: iNaturalist – ムラサキシジミ Arhopala japonica(yajapin)
Identifying an animal provides a starting point for learning about the fauna of a place. Your own observations and local survey reports reveal different parts of that picture.
What Can You Ask Once You Know the Name?
ミミズク先生After answering “What is this animal?”, you can ask, “What else has been recorded here?”
Suppose you identify a bird in a park. A local survey report may show which other birds have been recorded and when the surveys took place. You are then comparing one observation with records accumulated through several visits or studies.
Comparisons between places may reveal species recorded in both areas and others recorded in only one. These are clues to where animals occur.
They do not, by themselves, explain why the animals are there.
A bird at a pond might be feeding, using a breeding site or stopping during a journey. Its presence alone does not distinguish among those possibilities.
To investigate further, you would need information about its behaviour and the conditions around it, including food or breeding habitat. Establishing which animals occur is a starting point for asking why they occur there.
The Park Is Not the Path
A list made during a walk may look like a list of the park’s animals. Yet the area actually examined may have been only what could be seen from the path.
Recording birds and dragonflies while walking around a pond does not mean that the pond bottom or the insides of tree trunks were investigated.
A place name alone cannot describe the search area. “Observed from the path around the pond, within the visible area” is more informative than simply “recorded in the park”.
- Area: where was the survey conducted—throughout the site, at selected points or along a route?
- Period: does the record cover one day, a season or several years?
- Target: which animal groups were included?
- Method: were animals seen, heard or collected as specimens?
GBIF, the Global Biodiversity Information Facility, explains the importance of documenting survey methods and sampling effort alongside dates and locations.
GBIF is an international network that makes biodiversity data from specimens and observations available for use: records of which organisms were found, where and when.
The four questions above are an entry point, not a complete assessment of a study. Observer details, survey duration, number of visits and the evidence used for identification can make a record more informative.
Even then, the presence of such information does not, on its own, establish every aspect of survey quality.
 シロフクロウ職員
The park name tells us where the visit took place. The route and method tell us which part of its fauna the visit could reveal.
Reading a Faunal Survey: 31 Species Identified Around Hachijōjima
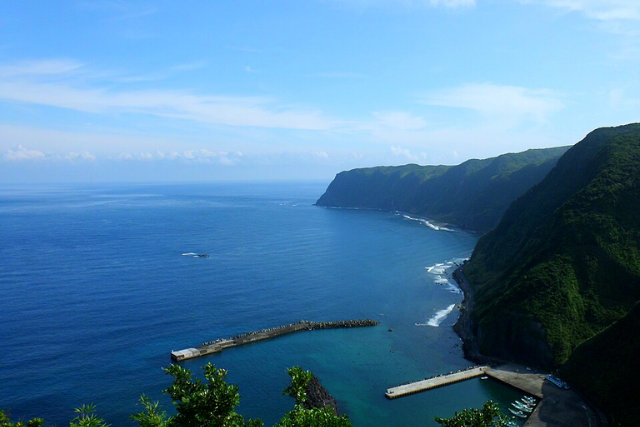
Source: Wikimedia Commons – File:Hachijojima.JPG

Photo credit: Matryokeshi
Survey reports provide evidence of which animals have been found in a place. Their value lies not only in the names, but also in the details of how the material was obtained.
One example is Hiroshi Namikawa’s 2011 report on hydrozoans collected around Hachijōjima Island, published by the National Museum of Nature and Science.
Hydrozoans belong to the cnidarians, the group that also includes jellyfish and sea anemones. The forms considered here attach to rocks or other organisms and grow as colonies of small, connected individuals.
What Was Collected, When and How?
The report drew on dredge surveys conducted around Hachijōjima between 2007 and 2009. The research vessel Takunan collected material from the seabed, including numerous hydrozoan specimens from rocky bottom habitats.
Dredging involves towing a collecting device along the bottom to obtain organisms, rocks or sediment for examination.
The report focused on thecate hydrozoans. Their small feeding individuals are enclosed by cup-like protective structures called hydrothecae.
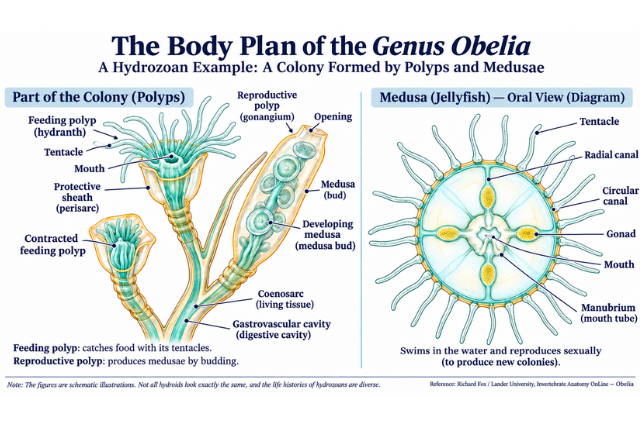
Reference: Richard Fox, Lander University — Obelia, 30 June 2006
- Area: sampling stations around Hachijōjima.
- Period: specimens collected in 2007–2009; report published in 2011.
- Target: thecate hydrozoans.
- Method: dredge collection followed by specimen identification.
- Result: 31 species identified at the time of reporting.
※Summarised from the main text, sampling-station table and species list in Namikawa’s 2011 report.
The report also describes a colony growing on the stem of another hydrozoan. Such details show that a specimen record can preserve more than a name.
The figure of 31 represents identifications within a defined group and collection. It is not the total number of animal species on or around the island, nor a complete inventory of all hydrozoans in the surrounding sea.
It should also be read as the identification result reported in 2011, not as a total recalculated under present-day classification.
Beside Each Name: Stations and Depths
The species list gives sampling-station numbers and depths alongside the names. A separate station table supplies the corresponding collection dates and positions.
ミミズク先生For example, Station 1, at 111–112 m, can be traced to a collection made on 25 July 2007.
Where a species was reported from several stations, the depth range in the species list summarises the depths of those stations. The station table is needed to examine each locality separately.
| Scientific name used in the report | Sampling stations | Depth given in the species list | What the entry records |
|---|---|---|---|
| Lafoea benthophila | 1 | 111–112 m | A thecate hydrozoan recorded from Station 1 |
| Campanularia chinensis | 1 and 5 | 111–236 m | A thecate hydrozoan recorded from two stations |
These entries establish that specimens identified as those species were obtained at the listed stations.
They do not show whether the species also occurred elsewhere, or at which depths they were most abundant.
Read only the names, and the list appears to describe a regional fauna. Move between the list and the station table, and the specimens supporting that picture become visible.
How Observations, Specimens and Publications Connect
Animal records may take the form of observations, preserved specimens or published reports. These may be connected stages of the same investigation rather than independent sources of evidence.
- An observation record may include the date, location, what was seen or heard, and supporting photographs or sound recordings.
- A specimen record connects a preserved object with its collection information and identification.
- A publication explains the study’s scope and methods, and how its findings relate to specimens or observations.
In the Hachijōjima example, collected specimens were examined and the findings published. Species names, station numbers and depths provide a route through that chain of evidence.
When combining sources, trace the underlying records where possible. A specimen cited in a second publication has not been collected a second time. The number of documents is not the same as the number of independent observations or collections.
 メンフクロウ職員
The species name tells us what the specimen was identified as. Its locality and date connect it to the circumstances in which it was collected.
シロフクロウ職員Those details need to stay together when the records are reorganised. A later researcher may need to follow the same trail.
Reading a Faunal Survey: Rove Beetles Beneath Stranded Seaweed
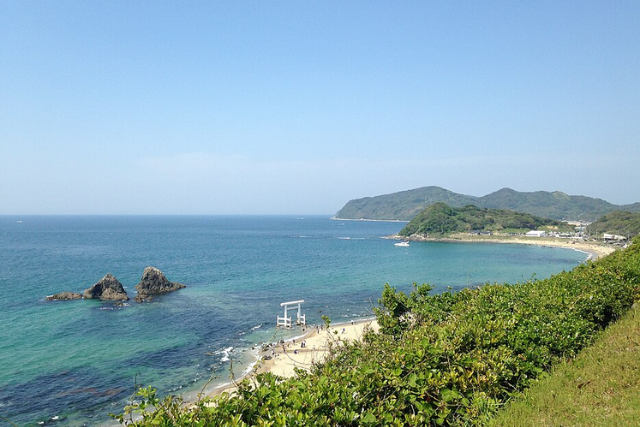
Source: Wikimedia Commons – File:Futamigaura Beach from observation deck of Futamigaura Cemetery 5.JPG(そらみみ)

Animals also live beneath seaweed washed onto a beach.
A report published in 2018 by Keiko Kawahara and colleagues recorded 13 species of rove beetles near the supralittoral zone on coasts facing Genkai-nada in Munakata, Fukutsu and Itoshima, Fukuoka Prefecture, Japan.
The study addressed a gap in knowledge. At the time, relatively few rove beetles had been recorded from the prefecture’s coasts, and dedicated surveys of this upper-shore zone had not been undertaken.
Rove beetles (Family Staphylinidae) often have short, hardened forewings that leave much of the abdomen exposed. The hindwings used for flight are folded beneath them.
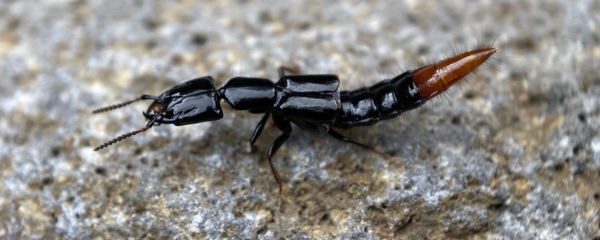
Illustrative photograph, included as a general example rather than as documentation of this survey.
Source: iNaturalist – 属 Homalolinus(merav)
The methods and results show how searching a particular part of a beach contributes to documenting its fauna.
Which Part of the Shore Was Examined?
The researchers concentrated on sandy areas near the upper shore, especially moist stranded seaweed.
They lifted seaweed together with the sand beneath it using a shovel, placed the material in a mesh basket, and collected beetles that fell into a tray below.
To examine adjacent environments, they also used this method on sand around plant roots farther landward.
- Area: Genkai-nada-facing coasts in Munakata, Fukutsu and Itoshima.
- Survey period: April–September 2017.
- Main target: rove beetles near the supralittoral zone.
- Method: collection from seaweed and sand using a mesh basket and tray, with additional sampling around plant roots.
- Recorded information: species, collection locality, date, number of individuals and survey time.
- Specimens: the paper states that the material would be deposited in the Kyushu University Museum.
※Summarised from the methods, Table 1 and species records in Kawahara and colleagues’ 2018 report.
The overall survey period was April–September, but the collection dates in Table 1 of the paper fall between April and June.
These details define what “13 species recorded on the coast” means. The figure is the number of rove beetle species summarised in that table, not the total number of insect species living on the beaches.
The paper separately reports other beetles and species considered to have been collected incidentally.
Read the Counts Alongside the Time Spent Searching
Table 1 gives species and individual counts for each beach, together with the total survey time. It also presents the number of individuals collected per 60 minutes.
| Beach | Collection dates in 2017 | Rove beetles collected | Total survey time | Individuals collected per 60 minutes |
|---|---|---|---|---|
| Futamigaura | 3, 11, 16, 22 and 30 May; 15 June | 30 | 190 minutes | 9.5 |
| Kōnominato | 21 April; 9 June | 176 | 100 minutes | 105.6 |
Raw counts are difficult to compare when search times differ. Expressing the collections per 60 minutes accounts for the difference in recorded survey duration.
It does not produce a measure of beetles per unit area.
The dates and numbers of visits also differ. The hourly values alone cannot establish which beach supported more rove beetles. The amount and condition of stranded seaweed, survey timing and other conditions also need consideration.
 タヌ山先生
Beetles per hour is a collection rate, not beetles per square meter. Check the denominator before you compare the beaches.
Separate the Findings from the Proposed Explanation
The researchers reported finding many species and individuals beneath moderately moist seaweed: material whose surface could be slightly dry while moisture remained within.
Few were found beneath seaweed that was dripping wet or excessively dry.
For Futamigaura, where relatively few individuals were collected per unit of survey time, the authors proposed several possible explanations. Stranded seaweed was scarce, the surveyed beach was gravelly and liable to dry out, and cleaning sometimes removed stranded material.
The study did not isolate the contribution of each factor.
| Statement | How to read it |
|---|---|
| Relatively few beetles were collected per unit of survey time at Futamigaura | A result obtained in the survey |
| Scarce seaweed and drying conditions on the gravel beach might help explain the result | The authors’ interpretation of possible causes |
ミミズク先生“What was found?” and “Why might it have happened?” are different questions.
To test the proposed explanations further, a comparison would need to hold constant or measure conditions such as seaweed moisture, quantity and survey timing.
A faunal report can therefore supply both species records and questions for further study.
The Identified Specimens Support the Records
Not every beetle in the survey could be identified to species from general external appearance alone.
To identify species in the subgenus Emplenota, the researchers dissected specimens and prepared microscope slides to examine male genitalia and female spermathecae—the structures that store sperm.
The researchers also asked another specialist to identify beetles belonging to the genus Cafius.
The paper states that the specimens would be deposited in the Kyushu University Museum.
Linking the actual specimens used for identification with their collection dates and localities makes the basis for the reported names traceable.
Knowledge of a familiar coastline’s fauna is built through these connected steps: collecting, identifying and recording.
What Does “Not Found” Mean?
When a name is missing from a list, first ask why.
Was the animal outside the survey’s scope? Was it searched for but not detected? Or was an organism recorded without a species-level identification?
These are different situations.
Not Surveyed, Not Detected or Not Identified
If a group or target was not investigated, it was not surveyed.Non-detection means that a target was sought but not confirmed.
An unresolved identification is different again: a specimen or photograph may exist, but its species has not been established. A record without a species name should not be confused with a survey in which no animal was detected.
Even when an animal is present, a survey will not necessarily detect it every time.
MacKenzie and colleagues’ 2002 study presented a method for estimating the proportion of sites occupied by a species while accounting for imperfect detection, using repeated surveys at multiple sites.
Non-detection records can contribute to analysis when the survey conditions are clear. The approach nevertheless relies on assumptions, including that occupancy at each site remains unchanged during the survey period and that the species is not falsely recorded as present at an unoccupied site.
Repeated observations alone do not establish absence.
シロフクロウ職員A blank cell might mean “not surveyed”, “not detected” or “not identified”. Those are different entries, even if the spreadsheet makes them look the same.
ミミズク先生If the reason for a blank is unknown, record it as unknown. An undocumented gap should not become a conclusion about the animal.
More Records Do Not Necessarily Mean More Animals
The Hachijōjima report describes additions to the records of hydrozoans known from the surrounding sea.
That is an increase in knowledge. The additional records do not, by themselves, show that those species had recently arrived.
Before comparing old and new lists, examine the area covered, season, method, survey duration and number of visits. Differences in the chance of finding animals must be distinguished from changes in their occurrence.
| Record or situation | What it supports | What it does not establish on its own |
|---|---|---|
| Thirty-one species identified from specimens | Thirty-one species in the target group were identified at the time of the report | Only 31 animal species occur in the region |
| A species name is absent from a report | The report does not list that species | The species is absent from the region |
| More species are known than before | Records and knowledge have increased | The number of species present has increased by the same amount |
| A species is not found during one visit | It was not detected under those conditions | It has disappeared from the region |
Differences between lists can prompt questions about environmental change. Before reaching a conclusion, however, examine differences in how the lists were made.
Making Useful Records Close to Home
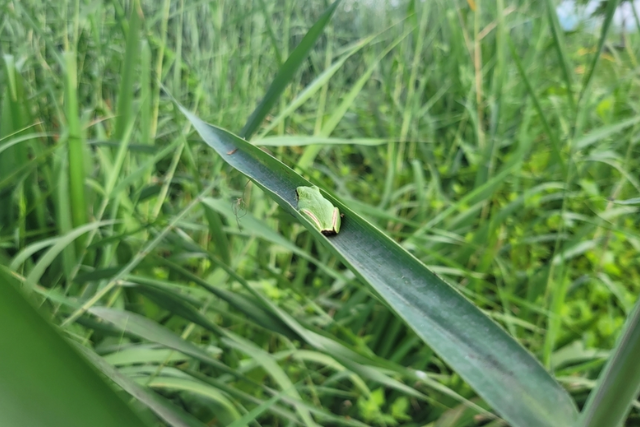
Source: iNaturalist – ニホンアマガエル Dryophytes japonicus(hyunkim969)
A seabed specimen survey and a short visit to a local park differ greatly in methods and scope. The principle of recording how a result was obtained is useful in both.
Decide on the Area, Target and Observation Time
Begin with a small, accessible area: part of a permitted path or a corner of a garden.
 ミミズク先生
Choose a manageable target, such as birds visible from the path or insects visiting flowers.
Ten to fifteen minutes may be a convenient starting point. This is a suggestion for getting started, not a claim that such a visit can adequately survey the fauna.
Record the start and finish times and the area covered.
Follow the site’s rules and observe from permitted routes. There is no need to chase animals or descend to the water’s edge. Begin with what can be seen and heard, without collecting organisms.
Record What You Could Not Resolve
A species name is not required before an observation can be documented.
Keep photographs or notes on colour, markings, movement and the place where the animal was found. An entry such as “bird—species unidentified” preserves what is known without filling the gap with a guess.
- Date, start time and finish time.
- Area covered or route followed.
- Animal group targeted.
- Method, weather and observer.
- Animals recorded and their names, where established.
- Photograph, sound-recording or notebook reference numbers.
- Unresolved identifications and the features documented.
- Targets selected in advance, and whether they were detected.
- Areas and groups not surveyed.
Recording methods and duration alongside dates and locations follows the principle of documenting survey conditions.
For “not detected”, record the outcome for something you had decided to search for. Something that was never included in the search is “not surveyed”.
Keeping those categories separate makes it possible to see, later, what was actually examined.
メンフクロウ職員Keep the observation and the uncertainty together. “Species unidentified; photograph 12” gives the next check somewhere to begin.
Even a small record can support comparisons if its conditions are preserved. An unidentified animal need not mark the end of an observation: the notes can show what to examine next.
Beyond the Name: The Records Behind a Place’s Fauna
Learning about fauna begins with establishing which animals occur in a place and bringing their records together.
When a list includes its area, period, targets and methods, it becomes possible to see both what the survey established and what it did not examine.
The name of one animal and the fauna of a place are connected through records. A return visit in another season, using the same method, can open another question.
ミミズク先生The next time a name falls into place, add where and when you found it. You do not need to complete the picture in a single visit. That small record gives you somewhere to begin when you return.
Explore More from the Museum of the Forest
 メンフクロウ職員
Please do explore the books from eco-life-planet as well. I hope they will offer you many more rewarding encounters with the living world.
Families of One: The Narrowest Branches of the Tree of Life
Kindle Books Currently Available in Japanese
The Japanese-language Museum of the Forest series includes expanded introductions to taxonomy, nature observation and unusual branches of the tree of life.
- An Introduction to Taxonomy: The Basic Science of Organising the World, Level 1 — Japanese-language edition
- Spring Nature Observation Handbook — Japanese-language edition
- Animals from Families of One: The Narrowest Branches of the Tree of Life — Japanese-language edition

References
References
What Is Fauna?
- Shogakukan. Digital Daijisen: “動物相” (animal fauna). Via Kotobank. In Japanese.
- Tanida, K. “ファウナ” (fauna). Encyclopedia Nipponica, Shogakukan. Via Kotobank. In Japanese.
- Tanida, K. “生物相” (biota). Encyclopedia Nipponica, Shogakukan. Via Kotobank. In Japanese.
- Secretariat of the Convention on Biological Diversity. “Article 2. Use of Terms.”
- MarLIN (2001). Identifying Species and Ecosystem Sensitivities: Appendix 4, General Glossary.
From One Animal to the Animals of a Place
- Tanida, K. “生物相” (biota). Encyclopedia Nipponica, Shogakukan. Via Kotobank. In Japanese.
- GBIF. “Introduction to Sampling-Event Data.”
Reading a Faunal Survey: 31 Species Identified Around Hachijōjima
- Namikawa, H. (2011). “Preliminary Report on Marine Thecate Hydrozoans Collected in 2007–2009 around Hachijōjima Island during Dredge Surveys by R/V Takunan.” Memoirs of the National Museum of Nature and Science, 47: 21–24.
- GBIF. “Introduction to Sampling-Event Data.”
Reading a Faunal Survey: Rove Beetles Beneath Stranded Seaweed
- Kawahara, K., Kido, K. and Maruyama, M. (2018). “福岡県玄界灘海岸で採集されたハネカクシ科甲虫” [Rove beetles collected on the Genkai-nada coast of Fukuoka Prefecture; translated title]. Bulletin of the Kyushu University Museum, 15–16: 17–30. In Japanese.
What Does “Not Found” Mean?
- MacKenzie, D. I. et al. (2002). “Estimating Site Occupancy Rates When Detection Probabilities Are Less Than One.” Ecology, 83(8): 2248–2255.
- Namikawa, H. (2011). “Preliminary Report on Marine Thecate Hydrozoans Collected in 2007–2009 around Hachijōjima Island during Dredge Surveys by R/V Takunan.” Memoirs of the National Museum of Nature and Science, 47: 21–24.
- GBIF. “Introduction to Sampling-Event Data.”
Making Useful Records Close to Home
- GBIF. “Introduction to Sampling-Event Data.”
- Fukuoka Prefecture. “ふくおか生きもの見つけ隊” [Fukuoka wildlife observation programme; translated description], conducted in fiscal years 2014–2016. In Japanese.
- MacKenzie, D. I. et al. (2002). “Estimating Site Occupancy Rates When Detection Probabilities Are Less Than One.” Ecology, 83(8): 2248–2255.
コメント