


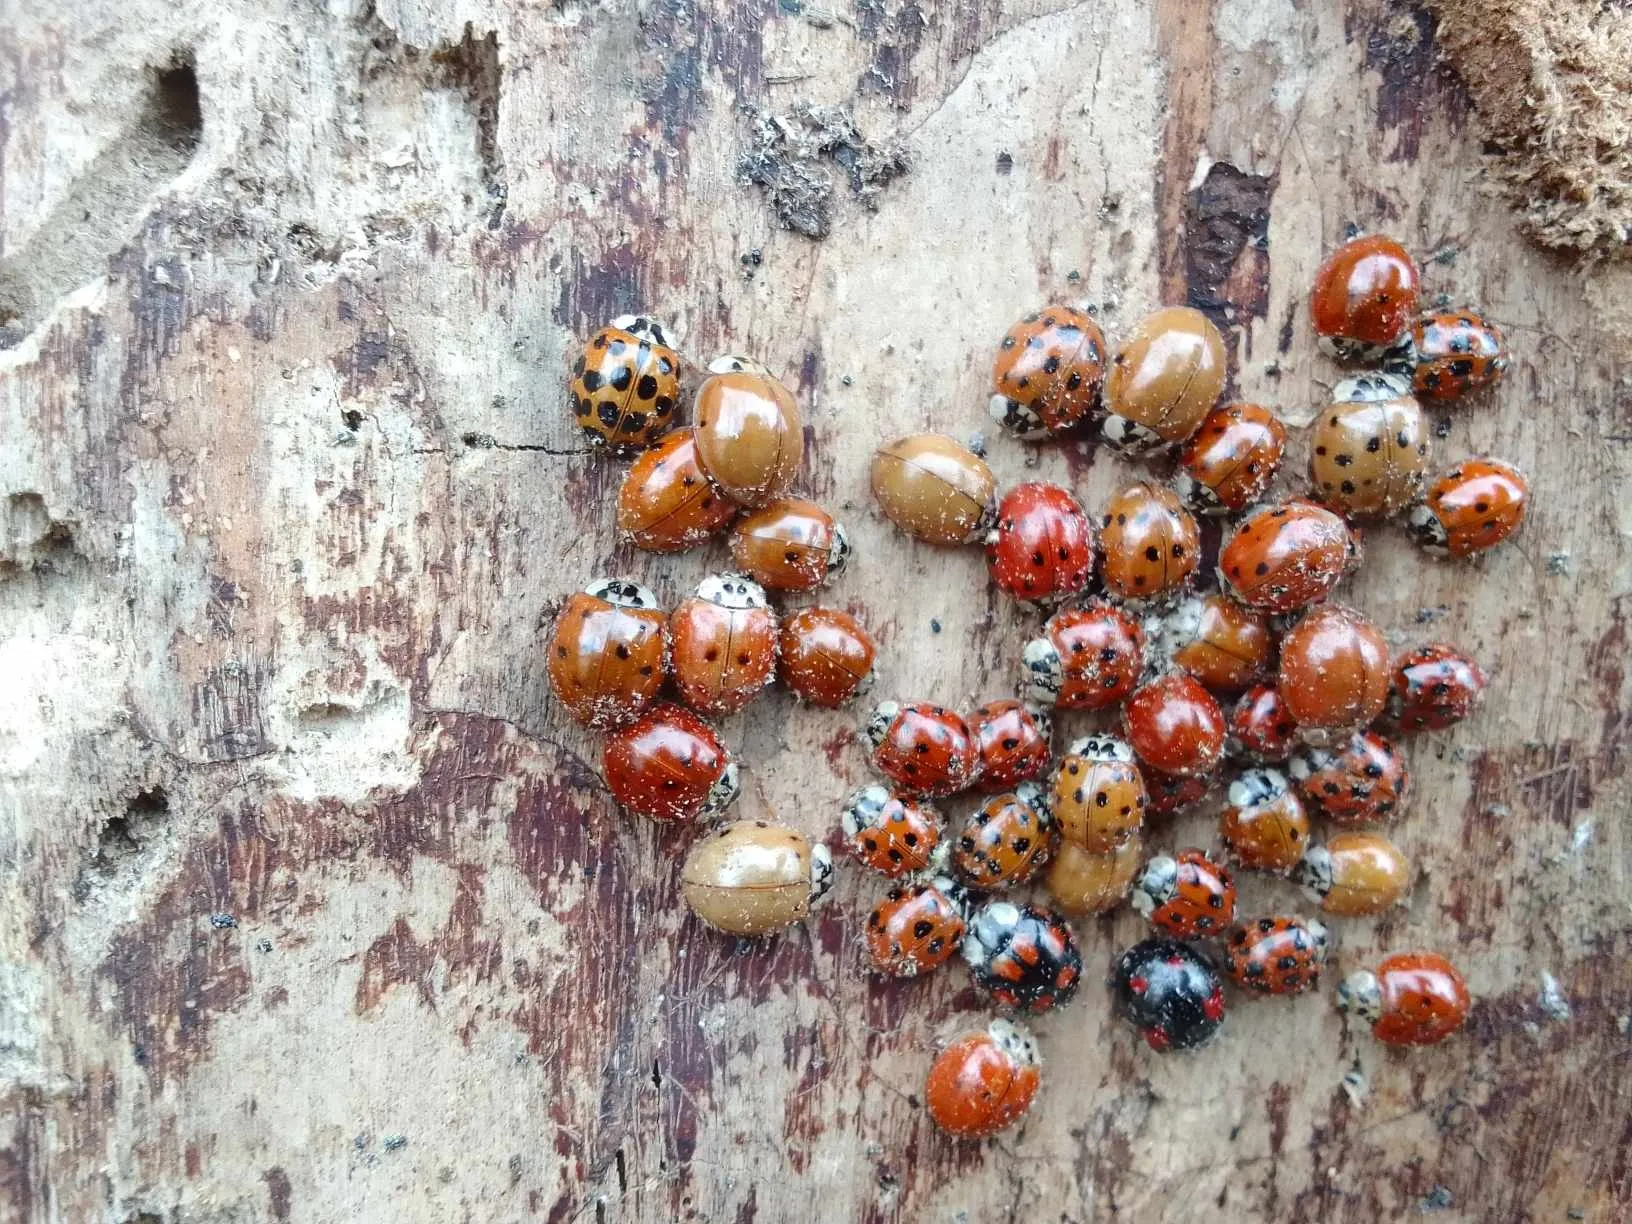
Cover image: Wikimedia Commons — File:Harmonia axyridis IT.jpg, by IvanHabiprot.

A woodland full of different trees, birds and insects offers an obvious introduction to biodiversity. Yet the variety of life extends beyond the number of species. It also includes genetic differences within a species and the diversity of ecosystems—the interacting communities of organisms and their non-living surroundings.[cbd]
Imagine standing at the edge of a wood, with a pond a little further along the path. At first, the trees, grasses and water form a single landscape. Now bring three questions to the scene:
- Which species live here, and how many individuals of each are there?
- What differences exist between individuals of the same species?
- How do living things interact with the conditions around them?
Each question brings a different part of the landscape into focus.
We will begin by counting trees, move closer to examine a ladybird’s markings, and then step back to compare woodland with a pond. Together, these examples show how biodiversity can become more than a term to learn: it can become a way of looking at nature.

Biodiversity Has More Than One Level
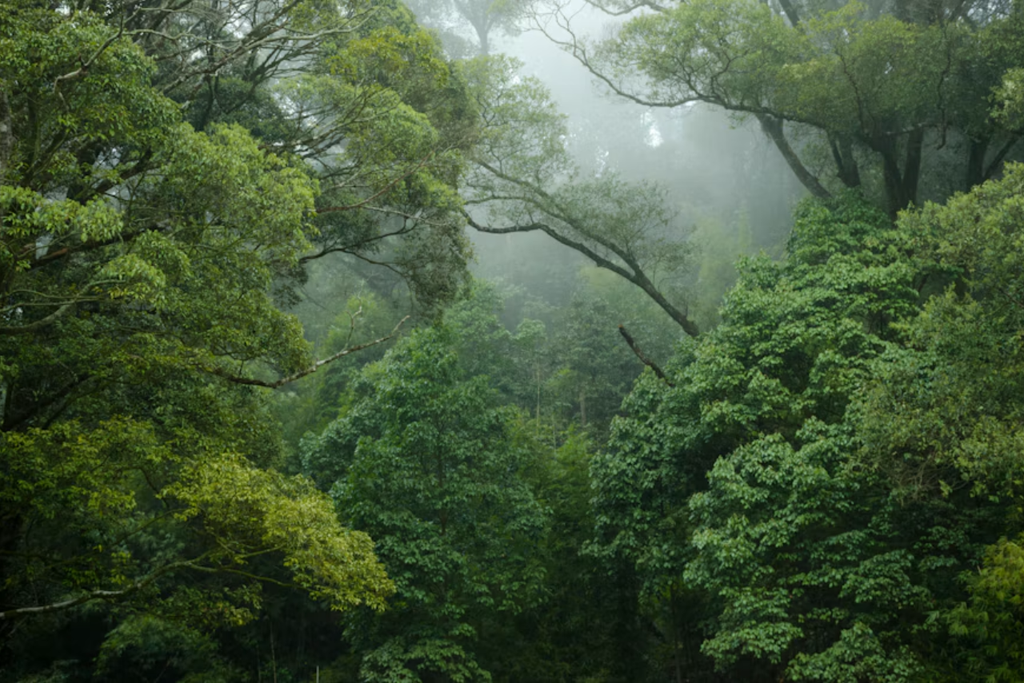
“There are lots of different species here” is a useful starting point. But a species count alone cannot tell us how many individuals belong to each species or what genetic differences exist within them.
The Convention on Biological Diversity defines biodiversity as including diversity within species, between species and of ecosystems. Its introductory guide also identifies genetic differences within a species as part of biodiversity.
These ideas are commonly introduced as three connected levels:
| Level | What are we comparing? | How can we investigate it? |
|---|---|---|
| Species diversity | Which species are present, and how abundant each is | Identify species and study their numbers and distribution |
| Genetic diversity | Inherited genetic differences within a species, including differences within and between populations | Study inheritance and compare DNA |
| Ecosystem diversity | Different combinations of organisms, their non-living surroundings and their interactions | Study organisms alongside water, soil, light and other environmental conditions |
These are not three names for the same thing. Each directs our attention towards a different aspect of nature.
 ミミズク先生
Let us begin with something we can count.
What Does Counting Species Tell Us?
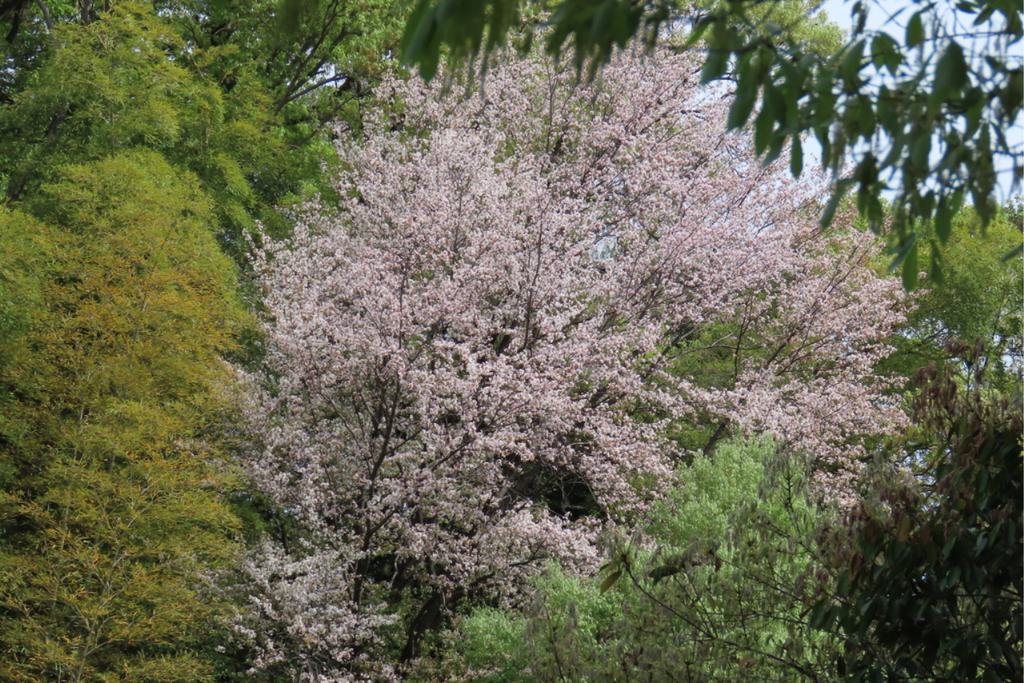
Source:iNaturalist – ヤマザクラ Prunus jamasakura(naturalistsy)
Suppose you want to find out how many tree species grow in part of a park.
First, choose your survey area: perhaps a patch of woodland enclosed by footpaths. Then identify the trees within that boundary.
Imagine you record three species: konara oak, sawtooth oak and Japanese mountain cherry. Whether you find one konara oak or twenty, it contributes one species to your total.
The number of species recorded in a defined area or sample is called species richness. In this example, the recorded tree species richness is three.
That figure answers a particular question: how many tree species did you record?
It does not tell you which species they were or how many trees belonged to each. Those details belong in your species list and individual counts.
Your choice of survey also matters. Here, you examined trees, so grasses and insects fall outside the total. To make the number understandable, record four essentials:
- When did you survey?
- Where did you survey?
- What did you look for?
- How did you look for it?
Together, these explain what your species count represents.
The Same Species Richness, a Different Balance
Now imagine surveying two woodland plots of equal size.
Each contains four tree species, labelled A, B, C and D. Each also contains twenty trees. Yet their individual counts look rather different:
| Tree species | Woodland I | Woodland II |
|---|---|---|
| A | 5 | 17 |
| B | 5 | 1 |
| C | 5 | 1 |
| D | 5 | 1 |
| Total | 4 species; 20 trees | 4 species; 20 trees |
This is a hypothetical example for explanation, not the result of a field survey.
Each separate organism being counted is an individual. In this example, each tree counts as one individual. The number of individuals belonging to a species in a defined area or sample is its abundance.
Woodland I has five individuals of every species. In Woodland II, seventeen of the twenty trees belong to species A.
The species list, species richness and total number of trees are identical. The distribution of individuals among the species is not.
Ecologists use the term species evenness to describe how evenly individuals are distributed among species. Woodland I has higher evenness because all four species have equal abundance. Some measures of species diversity take both richness and evenness into account.
This reveals something that “four species” leaves out. It does not, however, tell us that Woodland I must deserve greater conservation priority.
For that decision, we would need information absent from the table: which species are present, what environmental conditions occur there, and how the woodland has changed over time.
Describing the distribution of individuals and deciding conservation priorities are different tasks. A measurement can be useful without answering every question.
 シロフクロウ職員
So the table shows how the numbers differ, but not which woodland we should protect first.
ミミズク先生Exactly. First ask what the figures describe. Then ask what further evidence the decision requires. Those are related questions, but they are not the same question.
Individuals of the Same Species Can Differ
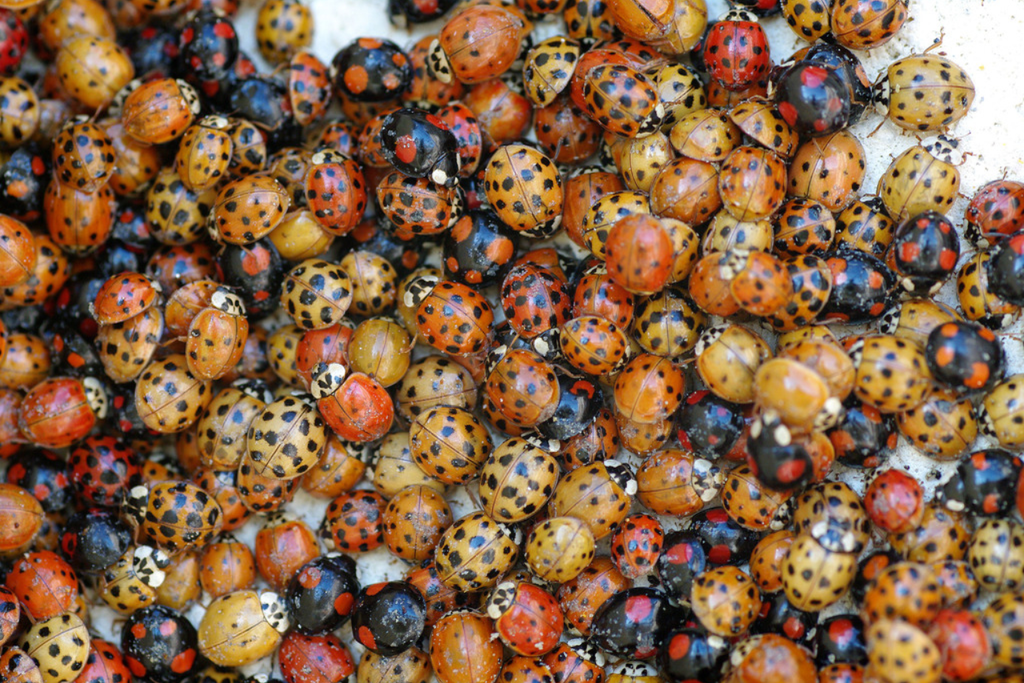
Source: iNaturalist – ナミテントウ Harmonia axyridis(dedete)
So far, we have compared species and counted their individuals. Now let us look more closely at the individuals within one species.
Organisms sharing a species name need not be identical. Differences can occur between individuals and between populations—groups of the same species living in a particular area.
Some differences are visible. Others become apparent only through closer investigation.
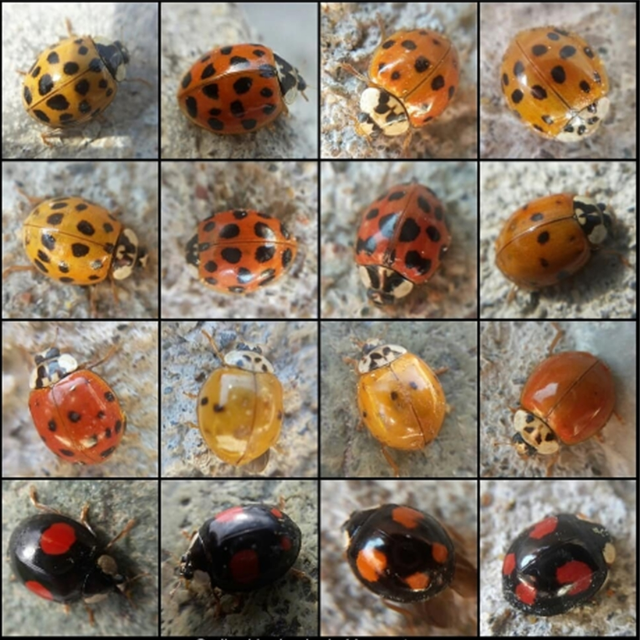
The harlequin ladybird, also known as the multicoloured Asian lady beetle, offers a particularly colourful introduction. Researchers have studied both its varied appearance and the genetic mechanisms behind it.
Different Patterns, the Same Species
Source: iNaturalist – ナミテントウ Harmonia axyridis(nihadkudo)
Picture a ladybird with black spots on a red background. Now picture another with red markings on a black background.
Both appearances occur in Harmonia axyridis. Their patterns may look strikingly different, but the insects belong to the same species.
The patterns appear on the elytra—the hardened forewings that form a beetle’s protective wing cases. A single wing case is an elytron. Comparing the number and position of spots, and the extent of red and black, reveals considerable variation within this species.
Differences among individuals or populations of the same species are called intraspecific variation. “Intraspecific” means “within a species”.
One source of this variation is differences in inherited genetic information. Genetic diversity refers to the variety of genetic information within a species.
It helps to distinguish this from phenotype: an organism’s observable characteristics. A phenotype can reflect genetic differences, environmental influences or interactions between the two.
A visible difference therefore gives us something to investigate, but does not by itself establish a genetic cause.
In harlequin ladybirds, researchers have connected inherited differences with colour-pattern variation. Nevertheless, individuals with the same pattern can still differ elsewhere in their DNA. Comparing markings provides an entry point into genetic diversity, not a complete measurement of it.
シロフクロウ職員So finding the species name is not the end of the observation.
 ミミズク先生
Not at all. A field guide may show several photographs of one species for a reason. Once you have found the name, leave the page open a little longer. There is still plenty to compare.
How Do Researchers Connect a Pattern to a Gene?
A difference in appearance gives researchers a question: what produces it?
Simply looking at differently patterned ladybirds cannot reveal the full cause. In a study published in 2018, Toshiya Ando and colleagues investigated a gene called pannier, combining experiments with DNA comparisons. These approaches addressed different parts of the same puzzle.
Testing the Gene’s Role
The first question was straightforward: what happens to the colour pattern if pannier activity is reduced?
The researchers used RNA interference, usually shortened to RNAi. This technique reduces the expression of a targeted gene—the process through which its information is used to produce a functional product.
They applied RNAi during the larval stage and examined the elytra after the insects became adults.
Across all four major colour-pattern backgrounds tested, black areas disappeared and red areas appeared in their place. The results showed that pannier was necessary for black pigmentation and also suppressed red pigmentation in the elytra.
The experiment therefore established an important part of the explanation: reducing this gene’s activity changed the colour outcome.
 メンフクロウ職員
But another question remained. If the same gene is involved, why do different ladybirds have black areas in different places?
Comparing the DNA
DNA contains more than instructions for making proteins. It also contains regulatory sequences that help control when, where and how strongly genes are expressed.
The researchers compared versions of the pannier region associated with different colour patterns. Different versions of a gene are called alleles.
They found substantial sequence differences in the first intron of pannier. An intron is a section within a gene that is copied into the initial RNA but removed during RNA processing. It does not become part of the protein-coding message, although it can contain regulatory sequences.
The comparisons also revealed traces of inversions: DNA rearrangements in which a stretch of sequence has been reversed.
The researchers proposed that differences in cis-regulatory sequences within this intron were a major cause of the colour-pattern variation. “Cis-regulatory” means that these sequences influence gene expression on the same DNA molecule. Here, the proposed effect was to change where pannier was expressed across the developing elytra, altering the position and extent of black pigmentation.
This interpretation was supported by several lines of evidence. It did not mean that every proposed regulatory sequence had been experimentally tested.
The approaches therefore answered complementary questions:
- Reducing gene activity tested whether pannier was necessary for normal colour formation.
- Comparing DNA helped identify differences associated with variation in the pattern.
- Examining gene expression helped connect pannier activity with the regions that would become black.
Together, these methods moved the investigation from “these ladybirds look different” towards an explanation of how their patterns develop.
There is an important limit, however. The study investigated the genetic basis of a particular characteristic: elytral colour pattern. It was not a complete assessment of genetic diversity across a population, and these results alone cannot establish a population’s risk of extinction.
Looking at Organisms and Their Environment Together
Source: iNaturalist – シロムネオオハシ Ramphastos tucanus(kdbishop69)
Our view now widens from species and individuals to the places where they live.
Organisms respond to their surroundings and also change them. A tree receives light, for example, while its spreading branches and leaves create shade beneath it.
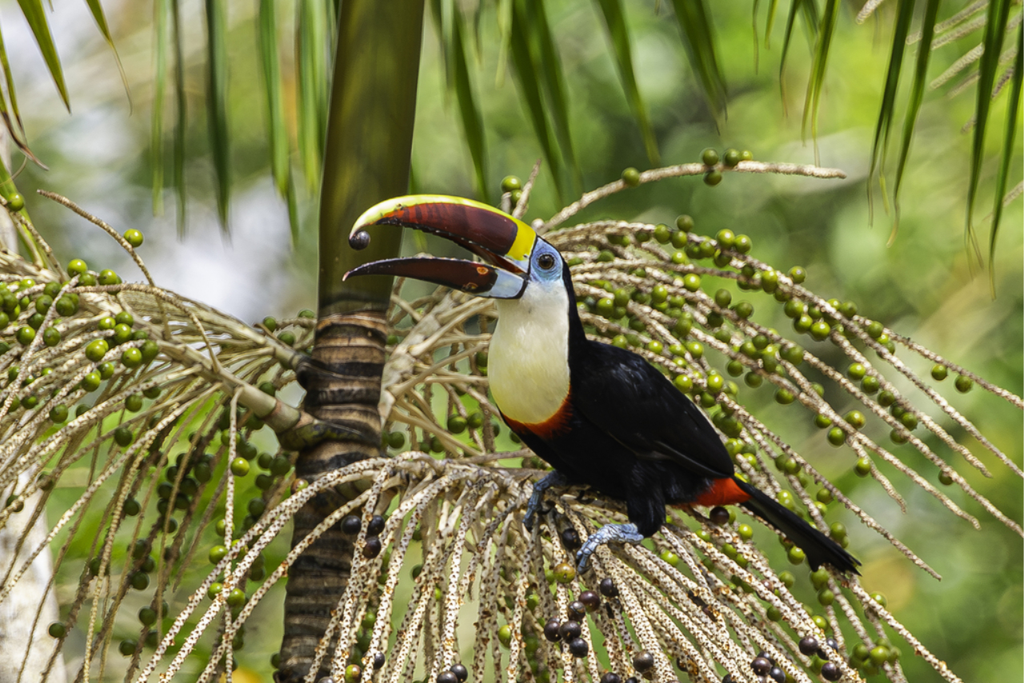
An ecosystem consists of a community of organisms and its non-living environment interacting as a functional unit. The important word is “interacting”: an ecosystem is more than a place with a species list attached.
The living parts are called biotic components. Non-living parts, such as water, soil and light, are called abiotic components. Studying an ecosystem means considering both, together with their interactions.
Biodiversity includes the variety of these systems.
From Woodland to Pond: What Changes?
Imagine following the path through a park woodland towards a pond.
Beneath the trees, beside the water and below the surface, both the organisms and their surrounding conditions change.
In the woodland, move your gaze from above your head to the ground. Tall trees spread their branches overhead. Smaller trees and shrubs occupy lower levels, with grasses and other plants closer to the soil.
Where branches and leaves overlap, they affect the light reaching the ground. Beneath your feet, fungi and other microorganisms form part of woodland life. The conspicuous trees are only part of the community.
At the pond, look from the bank to the water’s surface and then, where visibility allows, below it. Photosynthetic algae use light for photosynthesis, just as land plants do. Photosynthesis is the process by which light energy is used to build energy-rich organic compounds.
The presence of water is an obvious difference between these places. Looking at the ground, light and positions of organisms adds further detail to the comparison. These are practical starting points for examining organisms alongside their environmental conditions.
Using the same observation headings in both places makes the differences easier to organise:
| What to examine | In the woodland | At the pond and its bank |
|---|---|---|
| Water | Where is the soil damp? Where does water collect? | How deep is the water? Where is the water’s edge? |
| Ground or bottom | Where are soil, stones and fallen leaves? | Where are mud, sand and stones? |
| Light | Which places are shaded by trees, and which are open? | Which parts of the surface and bank are sunny or shaded? |
| Organisms | Where are trees, other plants, animals and fungi? | Which organisms occur in the water or along the bank, and where? |
These are suggested observation categories, not findings from a particular site.
Once you have made your notes, begin connecting them.
How much darker is the ground beneath overlapping branches? At what depths do aquatic plants grow? Does the same plant occur under several different conditions?
Recording organisms alongside their surroundings helps turn a list into questions about relationships.
Be careful about the next step, though. Finding an organism beside a particular environmental feature does not prove that the feature caused it to occur there. An observation can suggest an explanation without yet establishing it.
Exploring ecosystem diversity therefore involves more than listing landscape names such as “woodland” and “pond”. It means comparing organisms, environmental conditions and interactions.
Nor does every difference in conditions automatically mark a separate ecosystem. A sunny patch and a shaded patch may be parts of the same woodland ecosystem.
State the boundaries you are using: perhaps “the whole woodland” or “the pond together with its bank”. Clear boundaries make your comparisons easier to interpret.
Three Questions to Take on Your Next Walk
Source:iNaturalist – ニホントカゲ Plestiodon japonicus(mizudori)
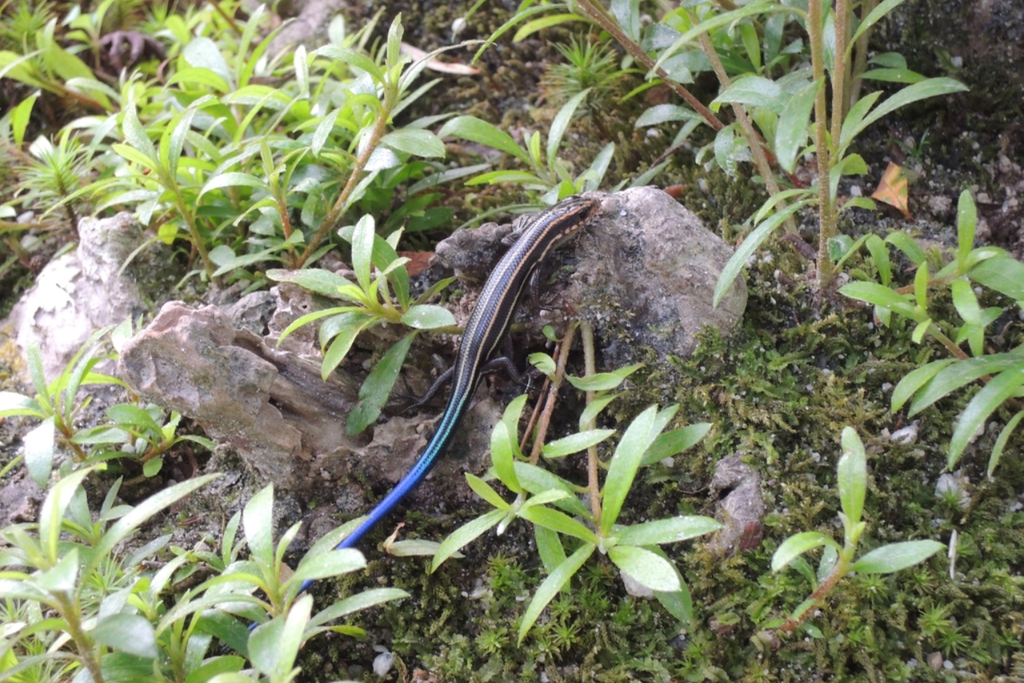
On your next visit to a park or another familiar natural area, choose one of these questions:
- Which species are here, and how many individuals of each can I find?
- What differences can I see between individuals of the same species?
- What are the water, soil and light conditions where an organism occurs?
You do not need to investigate everything at once. One question is enough to give your walk a focus.
Decide what you want to compare and where your observation area begins and ends. Then return to the four essentials: when, where, what and how.
Even an unidentified organism can become a useful observation if you record its visible features and the circumstances in which you found it.
| Record field | Example entry |
|---|---|
| Date and time | 12 October, 10 am |
| Location | Edge of the park woodland, on a sunlit grass leaf |
| Organism | One insect with black spots on a red background; species identification unconfirmed |
| Method | Found while walking and photographed |
This is an example of how to complete an observation record, not an actual field record.
A photograph may not show every feature needed for a reliable identification. Even so, it preserves details that you can compare with a field guide or other reference later.
Keep the location and circumstances of the find as well. They give you a fuller record to return to.
There is no need to fill an uncertain name with a guess. “Identification unconfirmed” accurately describes the stage you have reached.
Count species. Compare individuals. Examine the places where they occur. Even a familiar park can offer a different experience when you arrive with a different question.
メンフクロウ職員I would take a close-up of the organism and a wider photograph of its surroundings. Later, we could check both what it looked like and where it was.
シロフクロウ職員And if we photograph the same place on another visit, we will have something to compare—not only the organisms, but also the water and the pattern of sun and shade.
What Comes Into View Beyond the Species Count?
Source: iNaturalist – ペレイデスモルフォ Morpho helenor ssp. peleides(rafi1)
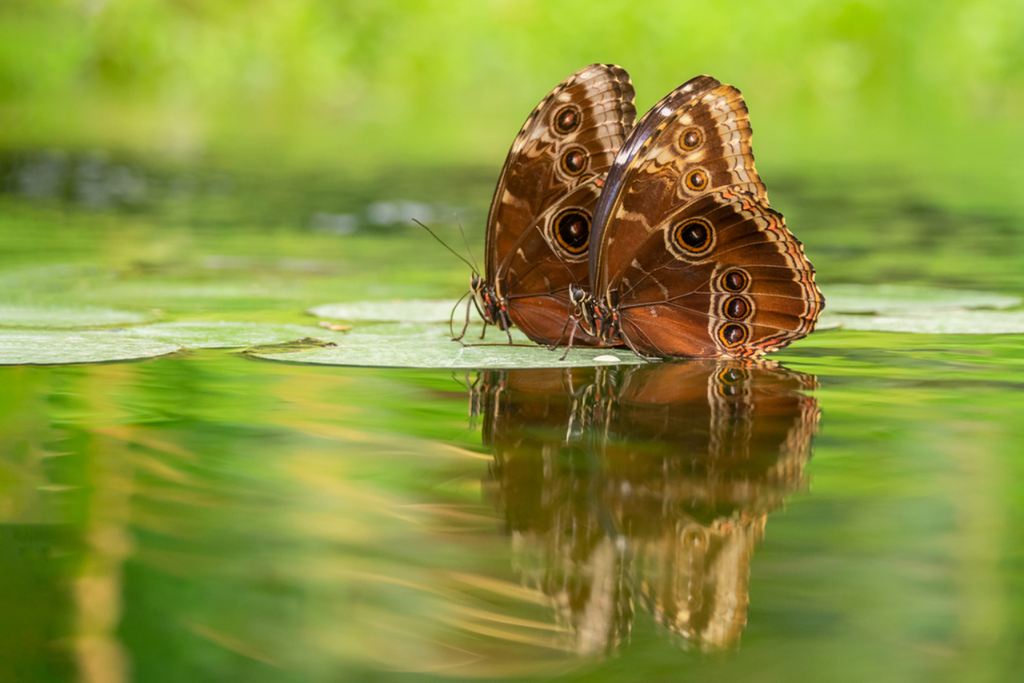
Biodiversity becomes easier to explore when we move between its levels.
Species richness tells us how many species we have recorded. Abundance and evenness reveal how individuals are distributed among them. Genetic diversity draws our attention to inherited differences within a species. Ecosystems bring organisms and their non-living surroundings into the same picture.
Our two imaginary woodland plots contained the same four species and twenty trees, yet their distributions of individuals differed.
Our ladybirds showed that striking differences can exist within one species—and that experiments, DNA comparisons and studies of gene expression can help reveal the mechanism behind a visible characteristic.
Our walk from woodland to pond widened the view again, allowing us to compare both the organisms present and the conditions around them.
Throughout, the central habit is the same: be clear about what you are comparing and how far the evidence takes you.
A species count does not settle conservation priorities. A colour pattern does not reveal an organism’s entire genetic make-up. Finding an organism in shade does not, by itself, explain why it occurs there.
Separating what we have observed, what the evidence supports and what remains uncertain gives us a clearer starting point for the next investigation.
As we become more attentive to differences, another puzzle begins to emerge:
“Why do organisms from different evolutionary lineages sometimes look so alike?”
A lineage is a line of descent—one branch of evolutionary history. Similarity in a particular feature does not mean that two organisms share the same overall body structure or the same evolutionary history for that feature.
In the next article, we will explore convergent evolution: the independent evolution of similar features in different lineages.
It offers another way to look at nature, by asking not only what makes organisms different, but also how their similarities arose.
Explore More from the Museum of the Forest
ミミズク先生Please do explore the books from eco-life-planet as well. I hope they will offer you many more rewarding encounters with the living world.
Families of One: The Narrowest Branches of the Tree of Life
Kindle Books Currently Available in Japanese
The Japanese-language Museum of the Forest series includes expanded introductions to taxonomy, nature observation and unusual branches of the tree of life.
- An Introduction to Taxonomy: The Basic Science of Organising the World, Level 1 — Japanese-language edition
- Spring Nature Observation Handbook — Japanese-language edition
- Animals from Families of One: The Narrowest Branches of the Tree of Life — Japanese-language edition

Reference
Biodiversity Has More Than One Level
- Convention on Biological Diversity Secretariat — Article 2: Use of Terms
- Convention on Biological Diversity Secretariat — Sustaining Life on Earth (16 September 2009)
- U.S. Geological Survey — NAWQA Glossary
- National Institute for Environmental Studies — Estimating the Abundance of Woody Plants Across Japan Using Biodiversity Big Data (14 May 2020; in Japanese)
Individuals of the Same Species Can Differ
- Ando et al. — Repeated inversions within a pannier intron drive diversification of intraspecific colour patterns of ladybird beetles. Nature Communications (21 September 2018)
- National Institute for Basic Biology and National Institute of Genetics — Identification of the Gene Determining Diverse Colour Patterns in Ladybirds (21 September 2018; PDF, in Japanese)
Looking at Organisms and Their Environment Together
- Convention on Biological Diversity Secretariat — Article 2: Use of Terms
- National Institute for Environmental Studies, Environmental Observatory — Various Ecosystems (in Japanese)
- National Institute for Environmental Studies — The Fascinating World of Microorganisms: Introducing the NIES Collection and Twitter (in Japanese)
- National Institute for Environmental Studies — Estimating the Abundance of Woody Plants Across Japan Using Biodiversity Big Data (14 May 2020; in Japanese)
コメント